Introduction to Candlestick Analysis on the Solana Chart
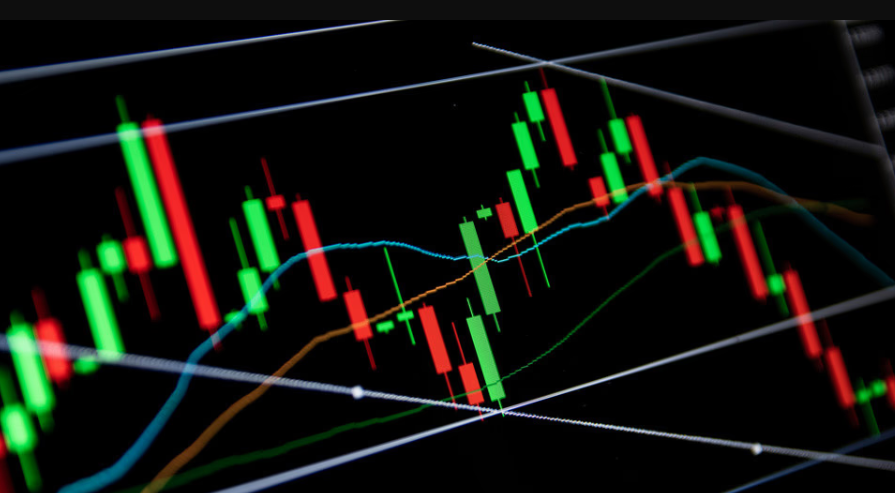
Candlestick analysis is one of the most powerful tools in technical analysis. On the solana chart, candlesticks reveal detailed information about price action, market sentiment, and trader behavior.
Each candlestick tells a story about the battle between buyers and sellers. Understanding these patterns helps traders anticipate potential market moves and make informed decisions.
What Are Candlesticks and Why They Matter
Candlesticks visually represent price data over a specific time period.
Key Components of a Candlestick
- Open price
- Close price
- High price
- Low price
The body and wicks together reveal strength, weakness, and momentum in the market.
Bullish Candlestick Patterns on the Solana Chart
Bullish patterns suggest potential upward movement.
Hammer
- Small body with long lower wick
- Indicates strong buying pressure after a sell-off
Bullish Engulfing
- Large green candle engulfs previous red candle
- Signals trend reversal
Morning Star
- Three-candle pattern
- Indicates shift from bearish to bullish sentiment
These patterns often appear near support levels on the Solana chart.
Bearish Candlestick Patterns
Bearish patterns warn of possible downside risk.
Shooting Star
- Small body with long upper wick
- Signals selling pressure
Bearish Engulfing
- Large red candle engulfs previous green candle
- Indicates bearish reversal
Evening Star
- Three-candle pattern
- Signals weakening bullish momentum
Recognizing these patterns helps manage risk effectively.
Neutral and Indecision Candlestick Patterns
Some patterns indicate uncertainty.
Doji
- Open and close prices are nearly equal
- Signals market indecision
Spinning Top
- Small body with long wicks
- Suggests possible trend pause
These patterns often appear before major price moves.
Using Volume to Confirm Candlestick Patterns
Volume adds confirmation to candlestick analysis.
- High volume strengthens pattern reliability
- Low volume may signal weak conviction
Always confirm candlestick signals with volume on the Solana chart.
Best Timeframes for Candlestick Analysis
Timeframe selection impacts accuracy.
Recommended Timeframes
- Daily: Strongest signals
- 4-hour: Balanced analysis
- 1-hour: Short-term trading
Higher timeframes reduce false signals.
Combining Candlesticks with Other Tools
Candlestick patterns work best when combined with:
- Support and resistance
- Trendlines
- RSI and moving averages
This layered approach improves decision-making.
Common Mistakes When Using Candlestick Patterns
Avoid these errors:
- Trading every pattern blindly
- Ignoring trend direction
- Forgetting confirmation
Patience and discipline are key.
FAQs About Candlestick Patterns on the Solana Chart
1. Are candlestick patterns reliable for SOL trading?
Yes, when confirmed with volume and trend analysis.
2. Which candlestick pattern is best for beginners?
Hammer and bullish engulfing patterns are easy to spot.
3. Do candlestick patterns work on all timeframes?
They work better on higher timeframes.
4. Should I use indicators with candlesticks?
Yes, indicators improve accuracy.
5. Can candlesticks predict exact price moves?
No, they indicate probability, not certainty.
6. Where can I practice candlestick analysis?
Platforms like TradingView are ideal.
Conclusion: Master Candlestick Patterns on the Solana Chart
Candlestick patterns provide deep insight into market behavior. By learning to read these formations on the solana chart, traders can better anticipate reversals, confirm trends, and manage risk.
Consistent practice and proper confirmation make candlestick analysis a valuable skill.